SFMc01
358 posts
msg #131912
- Ignore SFMc01 |
10/13/2016 9:18:19 PM
I often review TRO's many filters for quantifying "POPS." They often use, "set{DayRange,High - OPEN}"
I want to try something different and only measure what happens the day after a down day. To put it another way, I'd like to quantify how many times a stock goes up 1/2% and 1% following the day it went down. I have no idea how to do this and am requesting help from the gteat guys in this forum.
Thanks,
Steve
|
four
5,087 posts
msg #132232
- Ignore four
modified |
10/30/2016 2:28:12 AM
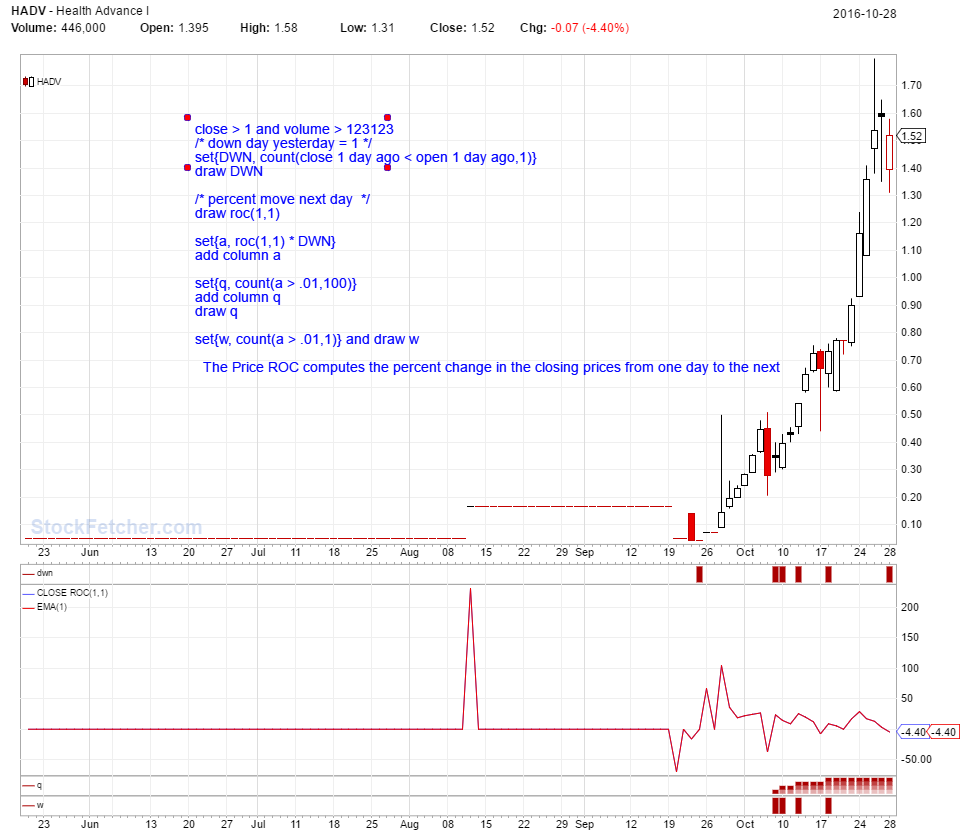
check this over and see if it is a start for where you want to go...
I believe we need to first identify yesterday was a down day and then multiply the true =1. An up day would be 0 and thus is not counted. Then check if 1% or better was achieved the next day with ROC change.
|
grizzly
1 posts
msg #133175
- Ignore grizzly |
12/11/2016 5:06:23 PM
Looking At The Chart You Have There, The Only Trade's You Need To Make A Great Living Are The Engulfing Candles.
|
shillllihs
6,102 posts
msg #133177
- Ignore shillllihs |
12/11/2016 5:26:29 PM
Why don't you tell us how you would play them Grizzly? Some will work, some won't. So what your strategy?
|