| StockFetcher Forums · Filter Exchange · Here is another filter on Momentum | << 1 2 >>Post Follow-up |
| SAFeTRADE 660 posts msg #128606 - Ignore SAFeTRADE |
5/21/2016 8:50:27 AM But maybe with a different take. Sort on rsq90 for a price that is closest to the trend. |
| pthomas215 1,251 posts msg #128607 - Ignore pthomas215 |
5/21/2016 9:32:11 AM Thank you for your generosity. I noticed on these that the RSI is good, its high, but not too high. Can we assume there is still room before a downturn on most of them? Are there certain industries that are better than others on this sf code? |
| SAFeTRADE 660 posts msg #128622 - Ignore SAFeTRADE |
5/22/2016 7:54:50 AM If you are a breakout trader possibly look for a cls20 to be between 80 and 100. If you buy the dips look for a cls20 between 45 and 55. In my opinion for the best trending stocks look for rsq90 above 75 and slope90 to be above 1.05. |
| Mactheriverrat 3,178 posts msg #128631 - Ignore Mactheriverrat |
5/22/2016 1:06:03 PM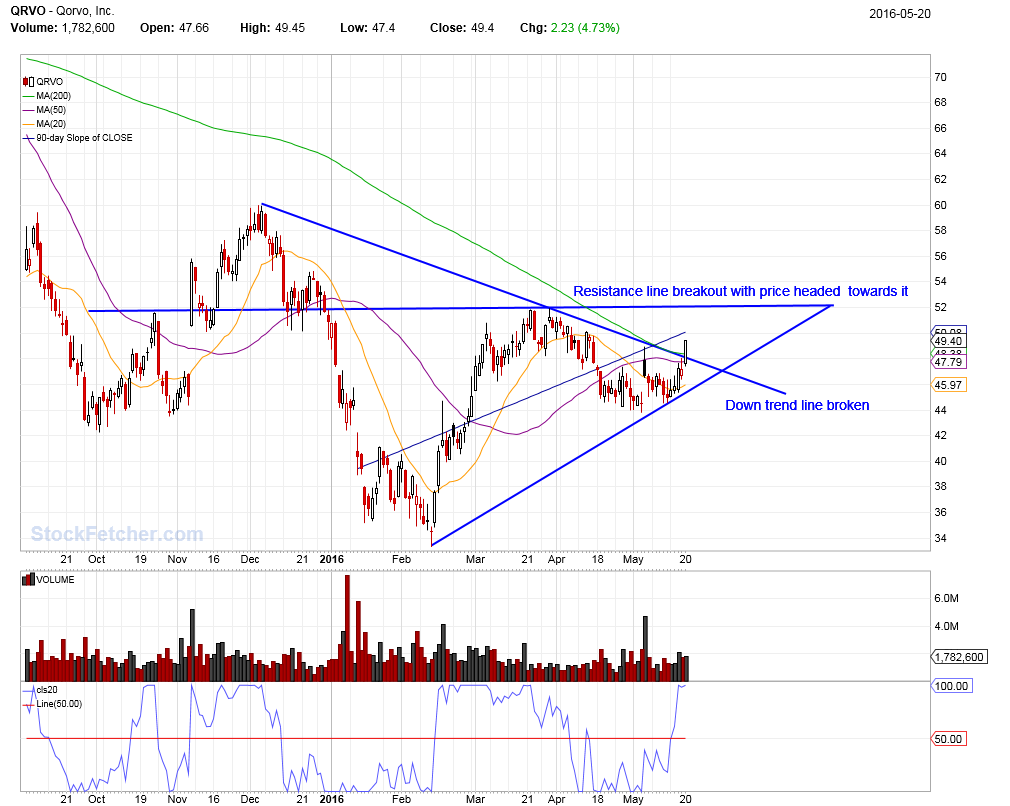 |
| SAFeTRADE 660 posts msg #128632 - Ignore SAFeTRADE |
5/22/2016 2:02:24 PM Exactly Mac and with above average volume(50). Good eye! |
| Mactheriverrat 3,178 posts msg #128634 - Ignore Mactheriverrat modified |
5/22/2016 4:32:24 PM It also broke over the MA(50). I bet that caught a lot of eyes when people are doing scans this weekend for plays for Monday @ SAFeTRADE I used your filter you posted. Then sorted % change from highest to lowest. Looked for stocks nearing a previous resistance line. QRVO was like the 2nd or 3rd one. |
| graftonian 1,089 posts msg #128635 - Ignore graftonian |
5/22/2016 4:40:04 PM Interesting way of looking at the problem, and thanks for sharing. |
| Mactheriverrat 3,178 posts msg #128637 - Ignore Mactheriverrat modified |
5/22/2016 4:57:35 PM One can also sort using the below code by days. Sort until day 1 shows up, make a mark right below the candle for that day and the draw resistance and support line. You can then see stocks nearing previous resistance line for a breakout. CxC is number of consecutive days close above (+)/below(-) previous close and set{CCb,days(close is above close 1 day ago,100)} set{CCa,days(close is below close 1 day ago,100)} set{CxC, CCa - CCb} and add column CxC {C_x_C} do not draw CxC  |
| papagatorga 124 posts msg #128694 - Ignore papagatorga |
5/25/2016 10:39:33 AM Great results looking back one week, not as good at two weeks. |
| pthomas215 1,251 posts msg #128701 - Ignore pthomas215 |
5/25/2016 11:51:52 AM I think multiple indicators passing the test can lead to a good swing trade. i.e. ) IFT just breaking out, MA(50) trending up, CCI(10) and CCI(61) just breaking above the red line, Current EMA(13) riding above price level, Support level reached if going long. I have noticed one thing specifically. a chart that has a sharp increase in CCI(10) and is just starting to go over the 0 red line always sees a ton of play the next day. anyone know how to write SF code to show stocks that do this? |
| StockFetcher Forums · Filter Exchange · Here is another filter on Momentum | << 1 2 >>Post Follow-up |